“Good, fast, cheap: pick any two” is an often heard project management statement. It is a trilemma from the classic management triangle. The joke is often used to subtly figuring out the budget, deadlines and the requirements.
A Venn diagram does perfectly visualise project limitations and makes it very understandable and logical.
Although this conceptual model helps us think about the project constraints, logically it is not very solid.

The “good, fast, cheap” premise doesn’t create a very useful correlative conjunction: fast and cheap are in software development nearly synonyms for each other. I can’t think of a lot of scenarios where it is possible to create good and cheap software while it is not delivered fast.
A scenario for the logical fallacy
I understand the schedule versus the spent time difference, but it is generally agreed that adding more people to a project doesn’t make it faster to develop.
The assumed scenario is as follows: we have system x, that can be developed by either 1 developer in 4 months or by 2 developers in 2 months. While this seems intuitive if it is considered purely from a Gantt chart perspective, reality has repeatedly shown that the development of the system by 2 developers can result in more time required and the total duration can be 5 months. (More time needed for communication [agreeing on the “right” framework], overhead of reading the same code by two people, inefficiencies by merging the code, interpretation of the requirements etc.)
The correlation between the amount of developers, the development time and the duration doesn’t necessarily exist and isn’t universally accepted.
Improved diagram
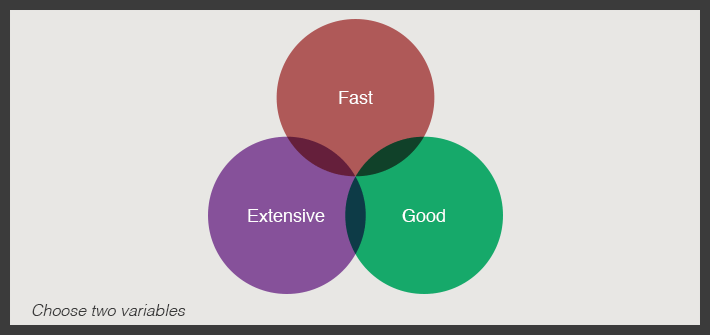
An alternative and maybe a more useful Venn diagram would be in my opinion:

Extensiveness of the software is an important factor for software projects. It includes the complexity of the requirements which is often appointed as one of the major critical success factors. Besides it is a key indicator for predicting the impact of requirement changes. It corresponds with the “scope” constraint from the classic management triangle.
Logical statements of my diagram
A system can be developed “extensive and fast”. This will automatically reduce the quality of the system. Because we stated that fast is a synonym for cheap, it also means that it will be inexpensive.
If the chosen bias is “good and extensive”, this will result that the effort and the duration will increase and makes it expensive.
If the system needs to be “good and fast” then it will lead to a system with less features but it will also be low cost.
Usefulness of diagrams
It may seem that showing a diagram makes life easy. Actually, in business meetings “now you have two problems”: you need to help the client to choose the right two constraints besides that you need to convince him that good, fast and extensive can’t be combined all together. So be careful.
Links
Critical success factors for software projects: A comparative study - http://www.academicjournals.org/sre/pdf/pdf2011/18May/Nasir%20and%20Sahi...
A survey study of critical success factors in agile software projects -
http://www.ccunix.ccu.edu.tw/~kcchen/PM/Presentations/2012.05.25/Team4.pdf
An instrument for measuring the key factors of success in software process improvement -
http://faculty.ksu.edu.sa/ghazy/Documents/Emp%20SWE%2000/An%20Instrument...
Defining software process model constraints with rules using owl and swrl - http://www.cc.uah.es/drg/jif/RodriguezEtAl_IJSEKE10ExtendedDraft.pdf
